Reports and dashboards
Numbers you can act on, and the two decisions behind them.
Your dashboards
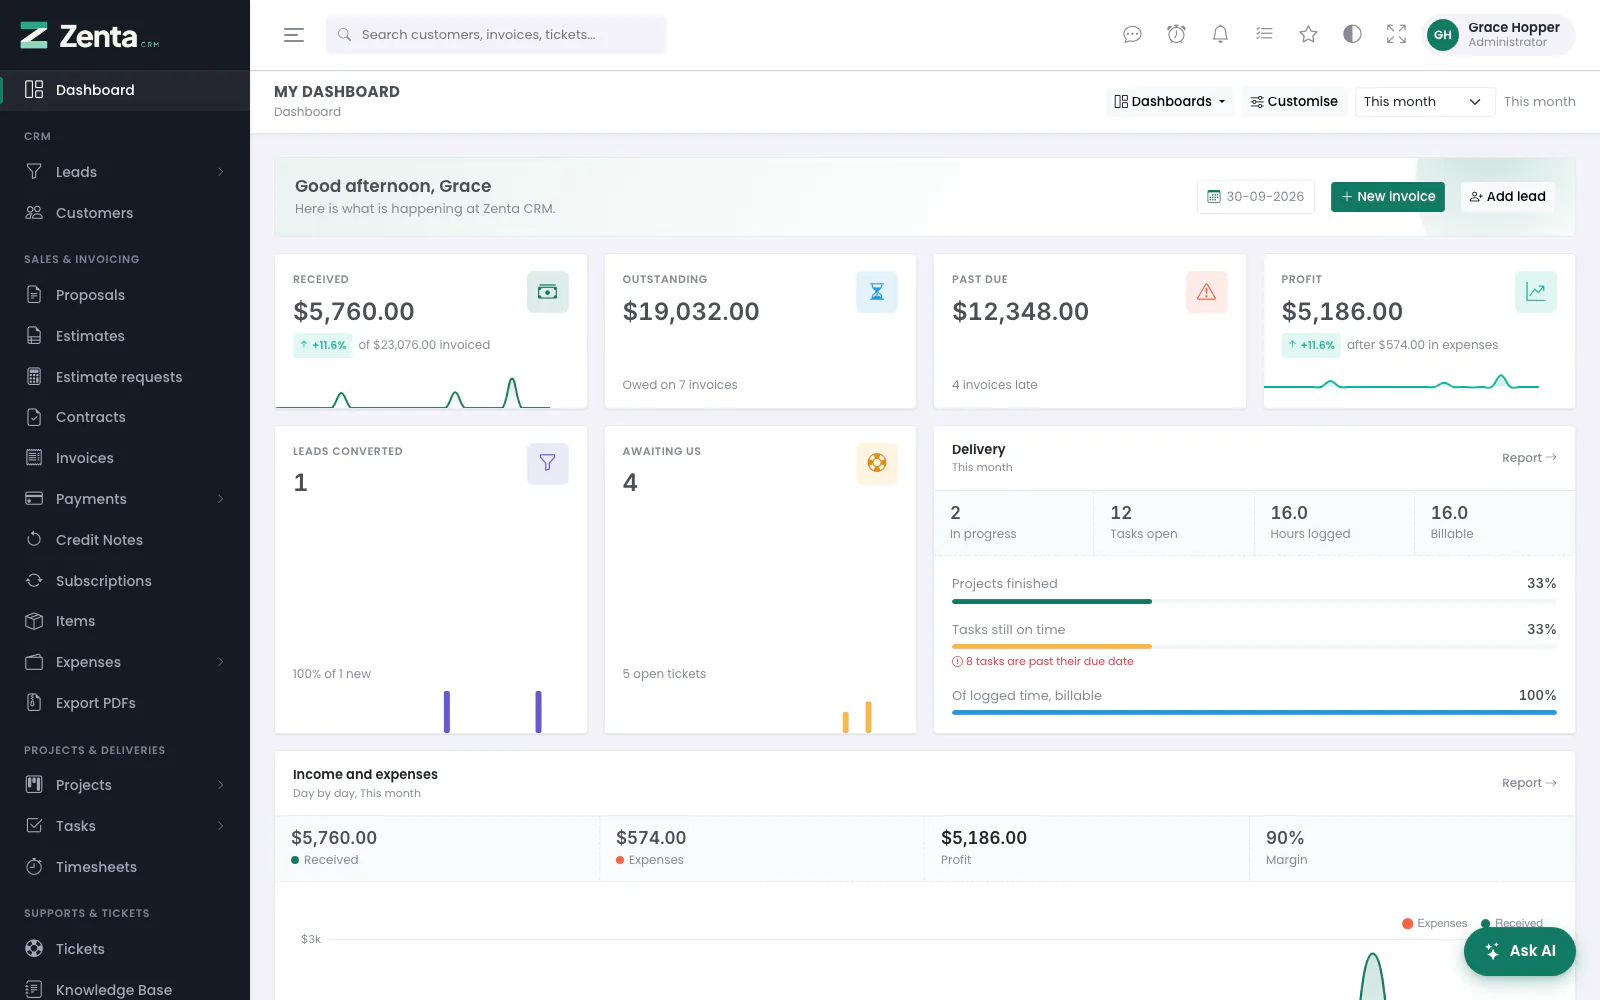 The dashboard: how the business is doing this month, and what you personally have to do.
Dashboard, at the top of the menu, is the page you land on after signing in. It opens on a greeting, the date and the two things most people came to do — New invoice and Add lead, each shown only to people allowed to — and then the panels.
A dashboard is a set of panels, and there are seventeen of them:
| Panel | What it shows |
|---|---|
| Money | Received, outstanding, past due and profit. The two period figures carry the change against the period before and a thumbnail of how they got there; the two positions carry the number of invoices behind them instead. |
| Leads | How many converted, what share of the new ones that is, and a year of conversions behind it. |
| Support | Tickets waiting on a reply from us — the ones that are somebody’s job this morning. |
| Delivery | Projects, open tasks and hours across the top; underneath, how much is finished, how much is still in time, and how much of the logged time is billable. |
| Income and expenses | Cash in as an area over cash out as columns, with received, spent, profit and margin along the top. A period of a quarter or less is drawn day by day; anything longer, month by month. |
| Invoices by status, Estimates by status, Proposals by status | A ring with the total in the middle and every status beside it with its count and share, in the same colours the status pills use everywhere else. |
| Where leads come from | Each source as a bar split into converted and not, with the best-converting source called out underneath. |
| Top customers | Who was invoiced the most in the period, what each still owes, and how they compare with the biggest. |
| Who is converting | Leads won per member of staff, with the rate beside the count so neither figure flatters anybody on its own. |
| Goals | Targets you have a stake in — yours, your team’s and the company’s — each as a ring with the days left beside it. |
| Coming up | The next entries in your calendar, with today tinted. |
| My tasks, My tickets, Overdue invoices | What you personally owe, and what is late. |
| Latest activity | Who changed what, newest first, with Activity log to open the whole log. Only for people who may read the activity log: View on staff with the scope All records (see The activity log). |
The period picker in the top right (This month to start with) governs every panel that covers a period; the ones that report a position — what is owed right now — deliberately ignore it. A panel with nothing to show is left out rather than drawn empty.
Several dashboards
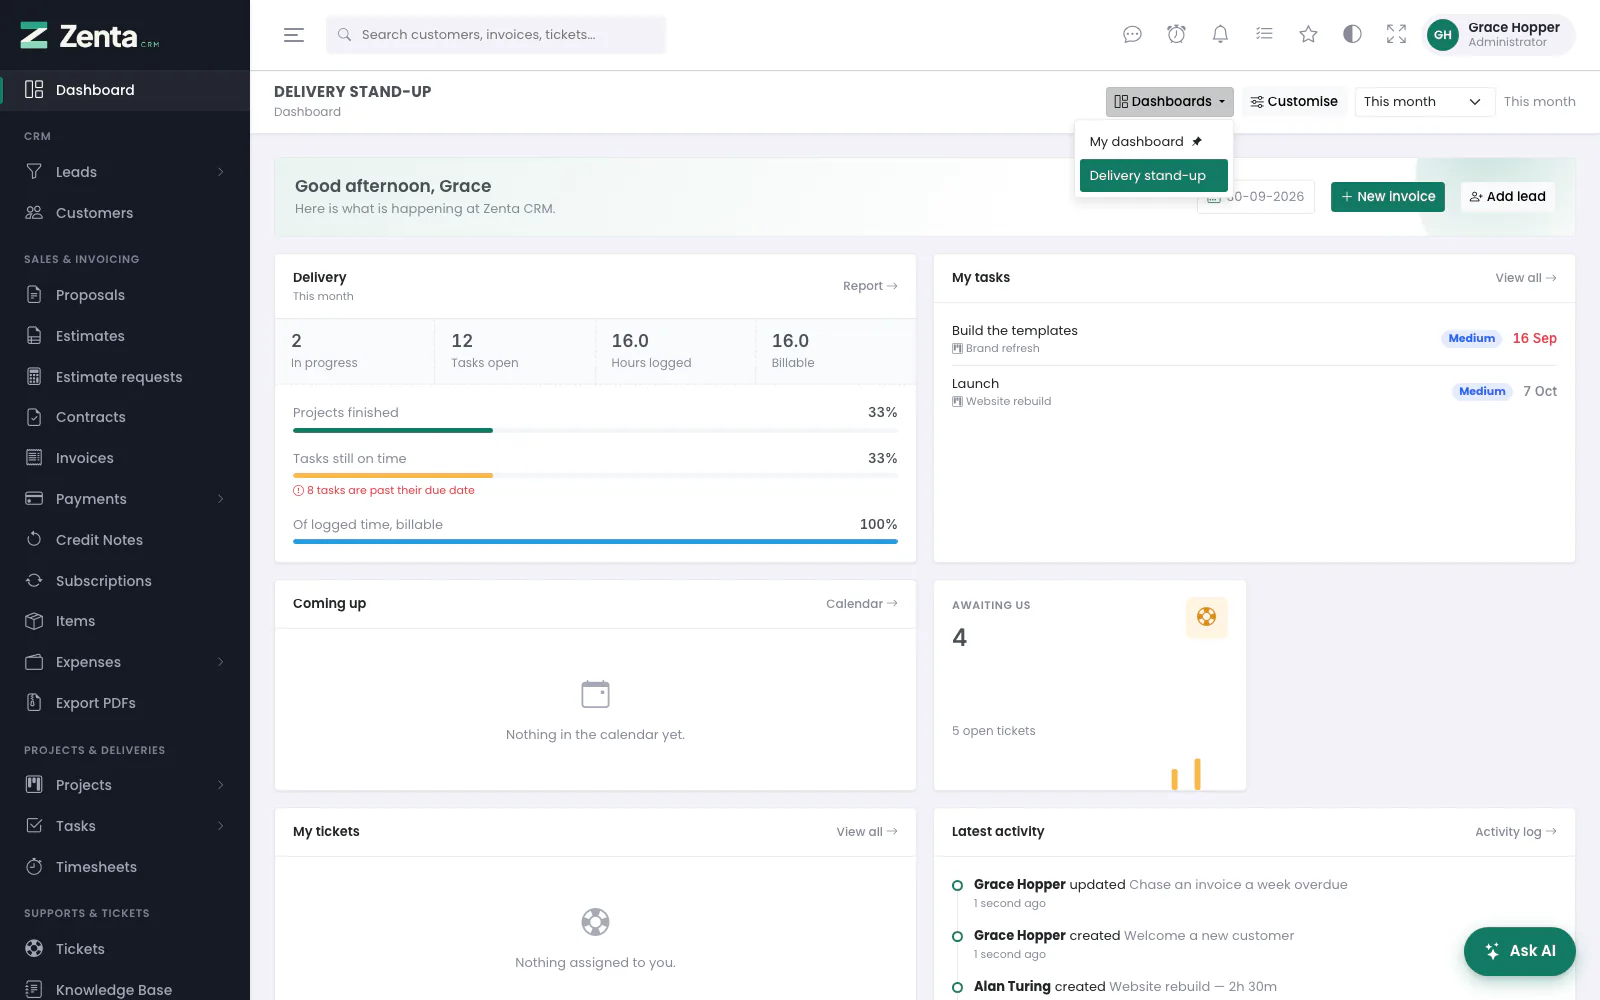 Dashboards: switching to another of your own. The pin marks the one that opens first.
You can keep several dashboards, each with its own name and its own panels — a Money one for the morning and a Delivery stand-up one for the stand-up, say, up to twelve. Once you have more than one, Dashboards in the top right switches between them; a pin marks the one that Opens first. Customise arranges the one you are looking at.
 Customise: the panels in order, each with its Show switch. New dashboard and Add are in the top right.
| On the customise screen | What it does |
|---|---|
| New dashboard and Add | Top right: type a name and press Add to make another dashboard, which opens here ready to arrange. A name you already use is numbered. |
| Other dashboards | Jumps to arranging another of yours. |
| Name | Renames the dashboard. Two of yours cannot share a name; a duplicate is numbered. |
| Open this one first | Makes it the one that opens when you sign in, after a confirmation. Exactly one at a time; the one that does already says This one opens first. |
| The handle, or Move up / Move down | Puts the panels in the order you want. The arrows work from the keyboard. |
| Show | Switches a panel off without losing its place. |
| Save dashboard | Saves the name, order and switches, and takes you to the dashboard. |
| Reset to default | Puts every panel back where it started and switches them all back on. Shown once the dashboard has been arranged. |
| Delete | Removes the dashboard after a confirmation. Never the last one — something has to open when you sign in — so it only appears when you have another. Deleting the one that opens first hands that to the next. |
| Back | Returns to the dashboard without saving. |
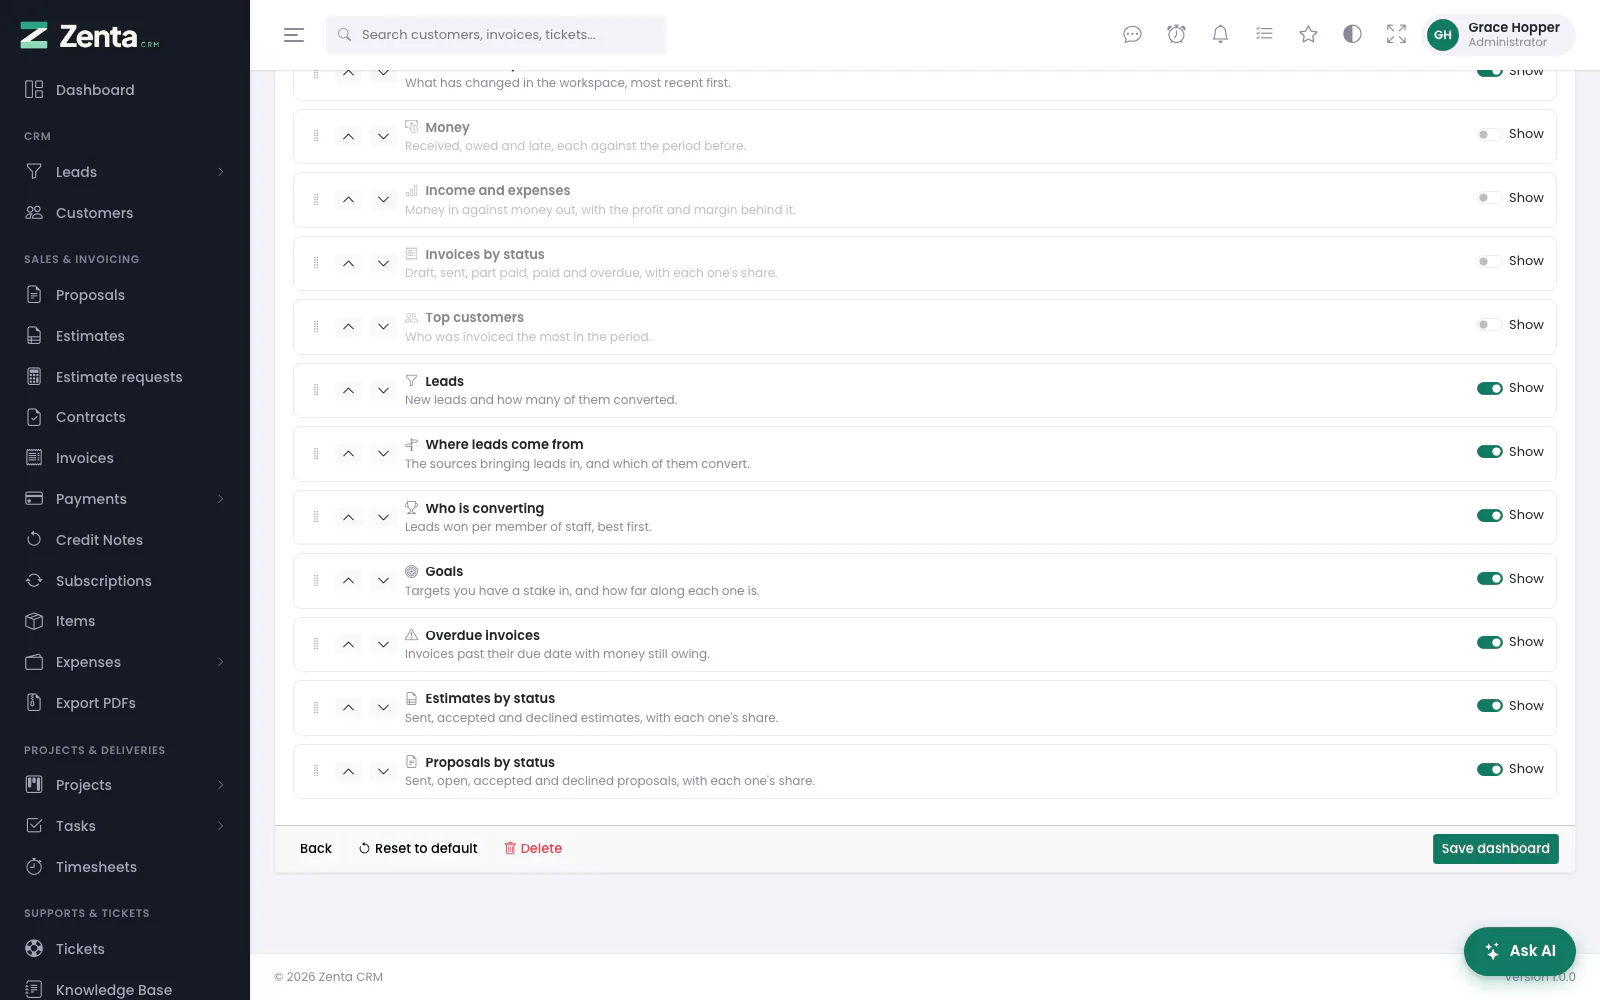 The foot of the customise screen: Back, Reset to default, Delete and Save dashboard.
A dashboard is yours alone.
Nobody else sees yours, and yours is never shown to anybody else, so there is no permission attached to dashboards themselves. Every panel is behind the permission for the thing it summarises, checked when the panel is offered and again when its figures are fetched — so arranging panels can never become a way to read figures your role denies you on the screen those figures come from. A panel whose module is switched off under Settings → Modules disappears with it, and comes back in its old place when the module returns. Somebody whose role allows no panel at all is told so: Your role does not include anything the dashboard can summarise.
A plugin can add a panel of its own through the admin.dashboard.widgets
filter; it is arranged, permission-checked and switched on and off exactly like the
ones that ship. A panel that draws a chart says so with 'charts' => true,
which is what decides whether the chart library is loaded at all — a dashboard
of nothing but lists does not pay for it.
The reports
 Organisation → Reports: the overview, with income against expenses month by month.
Organisation → Reports needs the Reports View permission; the CSV and Excel buttons need Export. A row of buttons across the top moves between the reports and carries the chosen period with you:
| Report | Answers |
|---|---|
| Overview | How is the business doing this period? Received, invoiced, expenses and profit; outstanding, past due, open tickets and unfinished tasks; income against expenses; and a summary of leads, delivery and support with Details links. |
| Sales | Received, invoiced, credited and profit; money in against money out; invoices, estimates and proposals by status with each status’s share; how customers paid; the pipeline; expenses by category; best-selling items; by customer group and by customer. |
| Invoices | What each client was invoiced — count, subtotal, discount, tax, second tax, TDS, total, received and due — with an All clients totals row, invoices by status, and the credit notes raised. |
| Payments | Money received month by month with refunds beside it, the payments summary, how customers paid, and the credit notes in full. |
| Income & expenses | Income, expenses, profit and margin month by month, this year against last month by matching month, where the money went by expense category, and where it came from by customer, each with a Statement link. |
| Leads | New leads, converted, conversion rate and value won; leads and conversions over time; by source and by staff member. |
| Delivery | Projects in progress, hours logged (and how much is billable, not yet invoiced), unfinished and overdue tasks; time by staff member; tasks by staff member; projects by team member; time by project against what was estimated. |
| Support | Opened, closed, awaiting our reply and the median time to close; opened against closed month by month and week by week; which day tickets arrive on; by priority, department and staff member; and knowledge base performance. |
| Surveys | A survey’s tallies live on the survey itself, where the questions are; the reports screen links straight to them. |
 The sales report: the four headline figures, income against expenses, and the status rings.
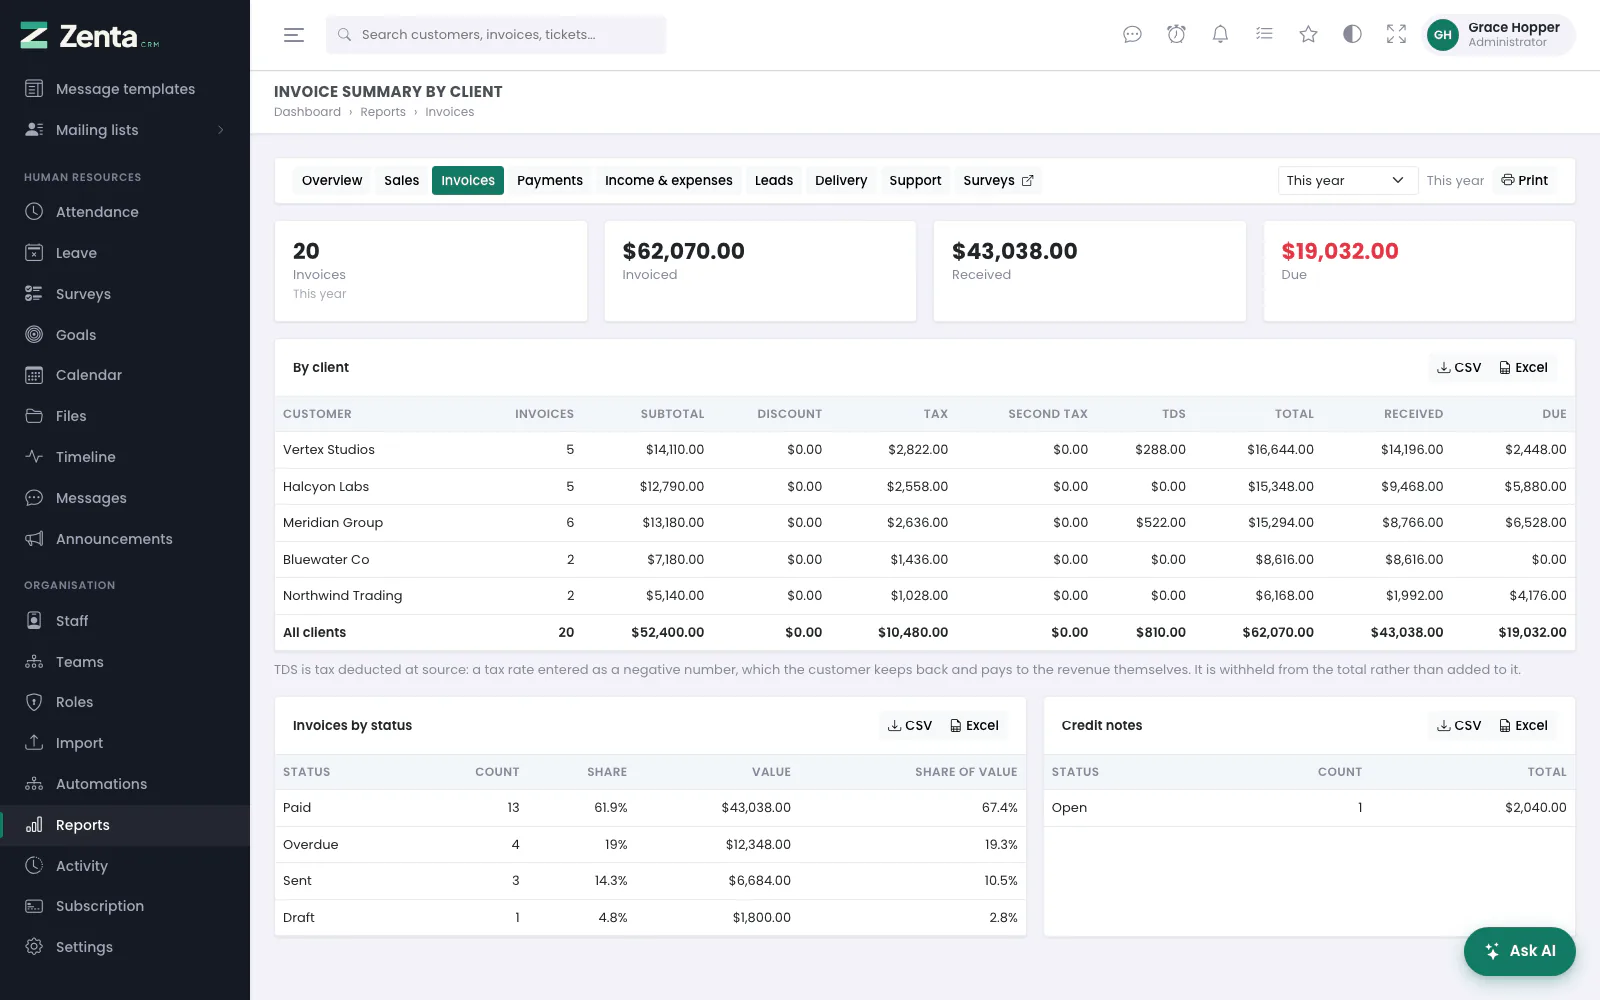 The invoice summary by client, with a totals row and both export formats.
 Payments received, month by month, with how customers paid.
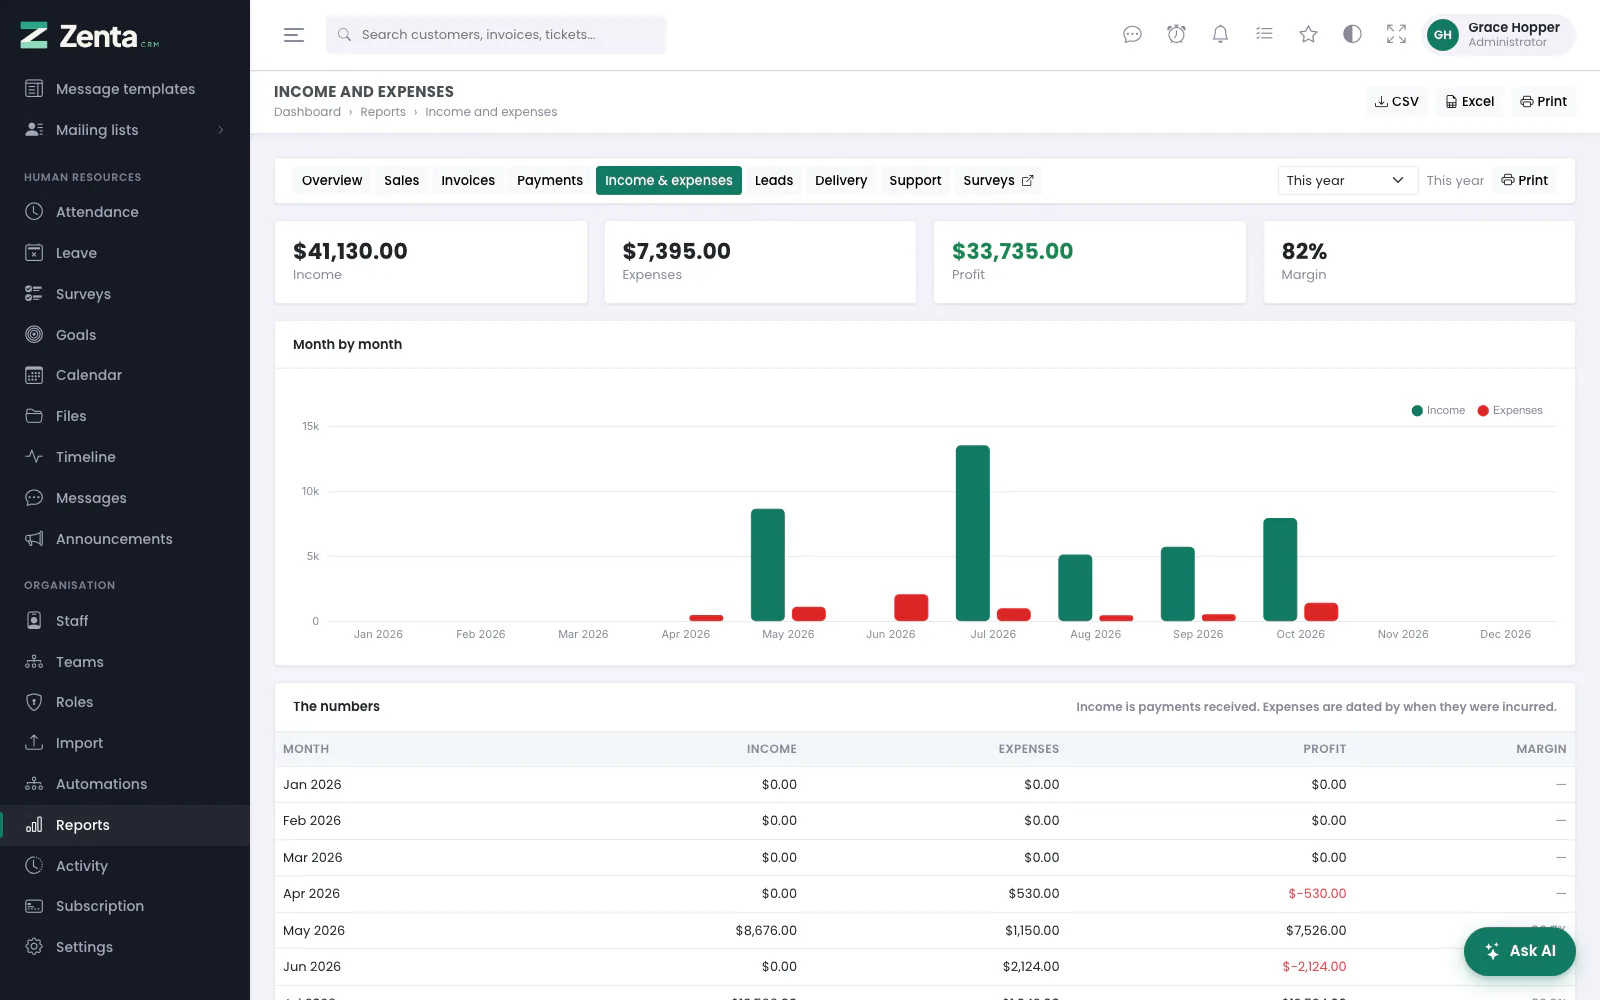 Income and expenses, with CSV, Excel and Print at the top of the page.
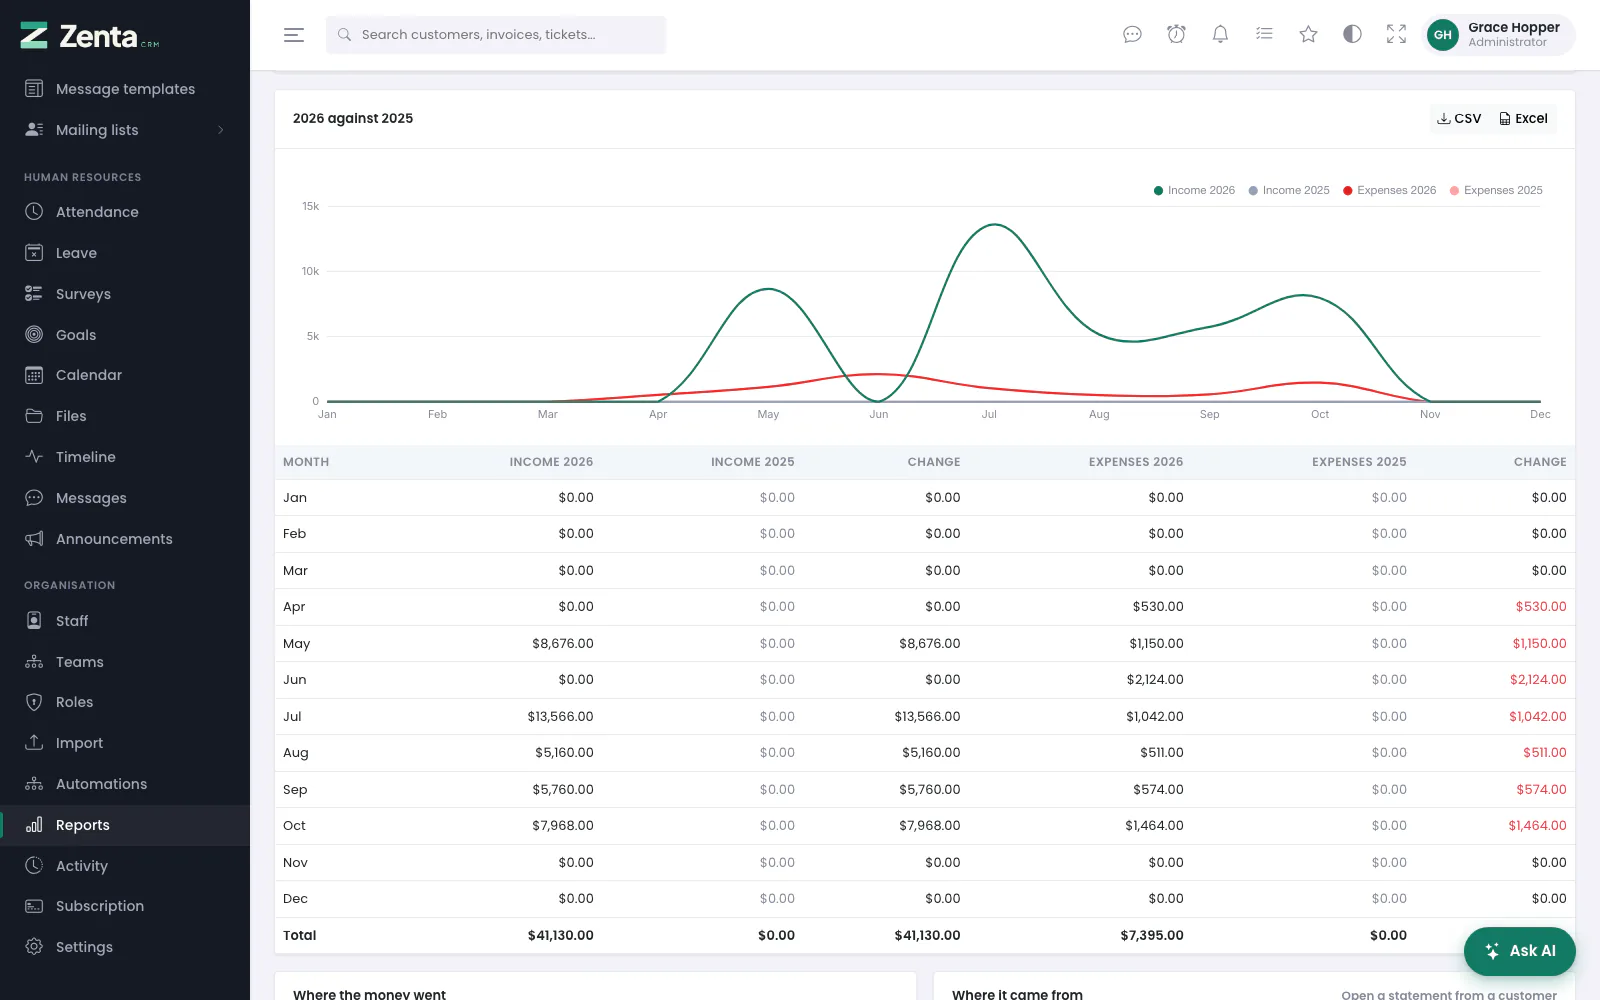 This year against last, month by matching month, with the change beside each.
 The leads report: conversions over time, by source and by staff member.
 The delivery report: time and tasks by staff member, projects by team member, time by project.
 The support report: opened against closed, week by week, and which day tickets arrive.
Two decisions worth knowing about
Income means payments received, not invoices raised.
An invoice is a promise; a payment is a fact. Reporting the two as one number is how a business talks itself into a cash-flow problem. Both figures are shown, side by side, and labelled.
Everything is converted to your base currency.
Each document is converted using the rate stored on it at the time, not today's rate. Reports therefore never restate history, and a total is never dollars added to euros.
Tax deducted at source
The invoice summary splits tax three ways: the first tax on a line, the second tax where you charge two, and TDS — tax deducted at source, which the customer keeps back and pays to the revenue themselves.
A withholding rate is entered under Settings → Tax rates as a
negative number, for example -10. It comes off the invoice total
instead of being added to it, prints on its own line in the tax breakdown, and the
report counts it as withheld rather than as tax charged. A business that does not
withhold never has to think about it: the sample data ships one rate, switched off.
A customer's statement
 A customer statement: every invoice and payment in date order, with a running balance and the balance owing.
Open a customer and press Statement, or use the Statement link beside them under Where it came from on the income report. It is the customer's account as a ledger: the balance brought forward when the period opened, every invoice, payment, refund and applied credit since, a running balance down the page, and the balance owing at the bottom. Choose the Period at the top; Print prints it. It needs the Reports View permission, and only opens for a customer you could open in the customer list.
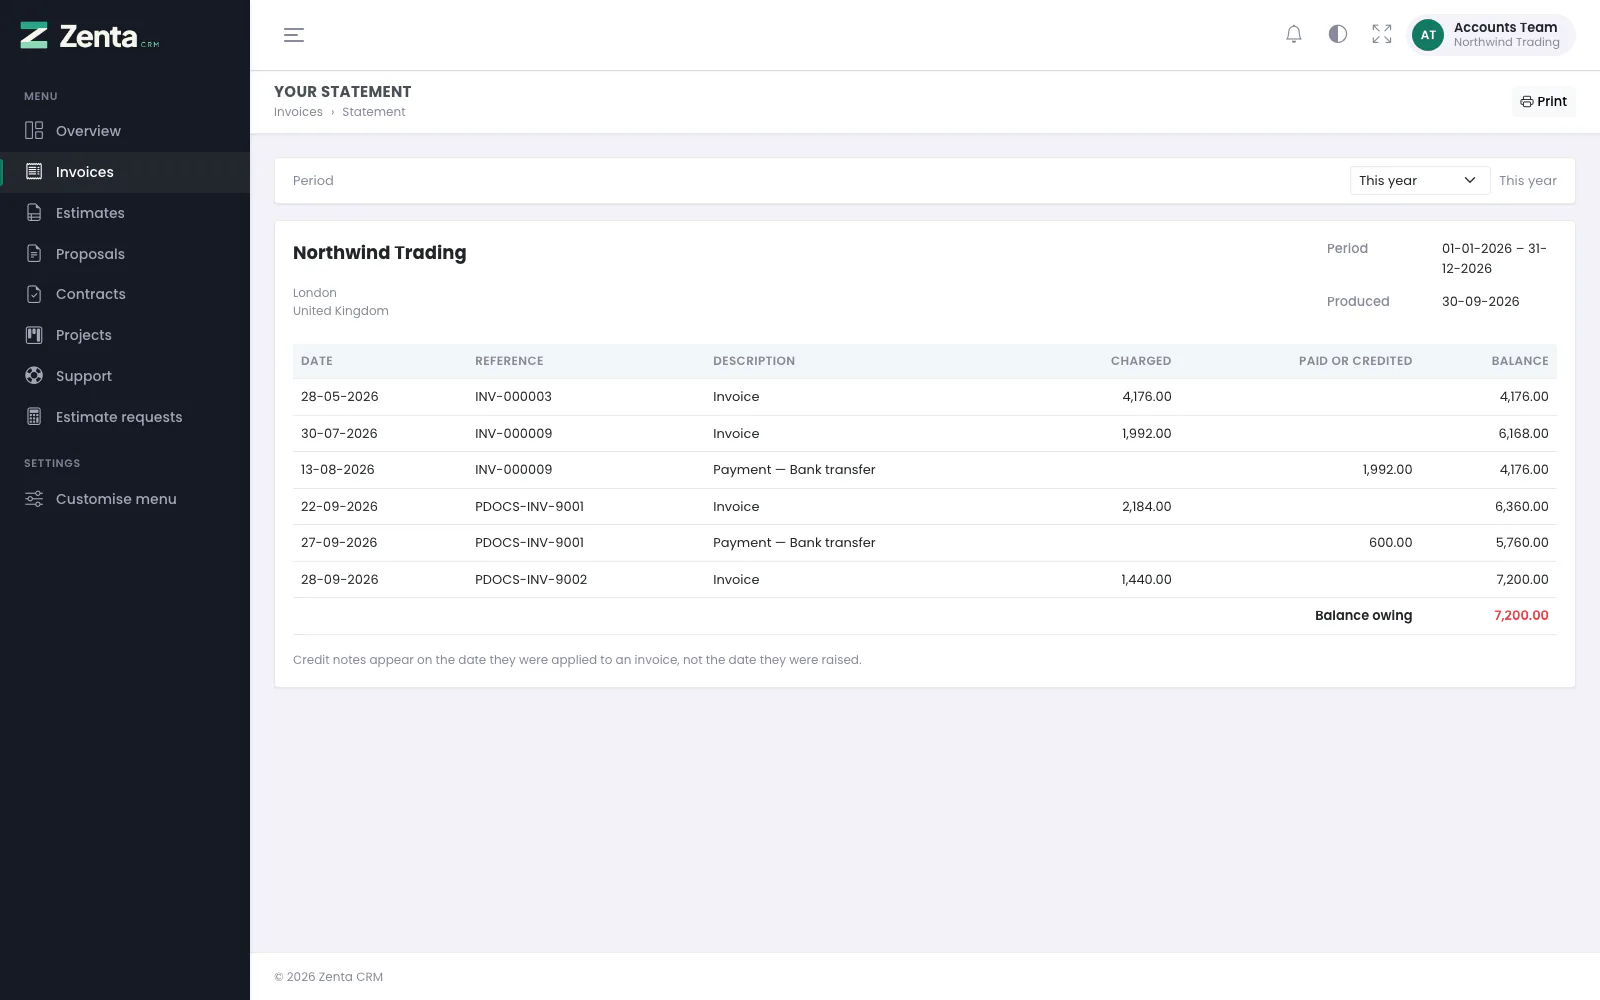 The same statement, as the customer sees it in the portal.
The customer can open their own from Invoices → Statement in the portal — the same statement, from the same code, so a customer ringing up about their balance and the person answering are looking at one set of numbers.
Drafts and cancelled invoices never appear: neither is a claim on anybody. A credit note appears on the date it was applied to an invoice, not the date it was raised — an unapplied credit is money agreed to but not yet set against anything, and showing it would make the statement disagree with every invoice on it.
Periods
Every report shares one period picker — This month, Last month, This quarter, This year (where the reports start), Last year, Last 3 months, Last 6 months, Last 12 months, All time, or a Custom range. The last-few-months choices count back from the start of the current month, so they are always whole months. Comparisons with “the period before” use the calendar period before for this month, this quarter, this year and last year, and an equal number of days before for anything else.
The one exception is this year against last on the income report, which is always twelve calendar months either way. “Against last year” only means anything month against matching month, and a six-week window next to the six weeks a year earlier is a chart nobody can read.
Getting the numbers out
Every table has CSV and Excel beside it, and the
income report has both at the top of the page. The file holds the same figures the
table shows, for the same period, and is named after the report and its dates.
CSV opens in Excel, Numbers or Sheets, with the encoding set so accented characters
and currency symbols survive. Excel is a real .xlsx workbook with a
frozen heading row, dates as dates and money as numbers you can sum — written
without a spreadsheet library, so there is nothing extra to keep patched.
Reports also print cleanly: use your browser's print command, or the Print button beside the period picker, and the navigation and the export buttons are dropped automatically.
zip extension — an .xlsx file is a zip. Ask your host
to enable it, or use CSV, which needs nothing. A cell that begins =,
+, - or @ is written as text in both formats,
so a customer named after a formula cannot run anything on the machine of whoever
opens the file.
Addresses on this page
For reference and for anyone scripting against the panel. Everything here needs somebody signed in to the workspace whose role allows it; anybody else is refused.
| Method | Address | What it does |
|---|---|---|
GET | admin | The dashboard; dashboard picks one of yours, and period (with from and to for a custom range) the period. |
POST | admin/dashboards | Makes a new dashboard (name) and opens its customise screen. |
GET | admin/dashboards/{dashboard}/customise | The customise screen for one of your dashboards. |
PUT | admin/dashboards/{dashboard} | Saves a dashboard's name and panels. |
POST | admin/dashboards/{dashboard}/default | Open this one first. |
POST | admin/dashboards/{dashboard}/reset | Reset to default. |
DELETE | admin/dashboards/{dashboard} | Deletes a dashboard (never your last). |
GET | admin/reports | The overview. Every report takes period, from and to. |
GET | admin/reports/sales | The sales report. |
GET | admin/reports/invoices | The invoice summary by client. |
GET | admin/reports/payments | The payments report. |
GET | admin/reports/finance | Income and expenses. |
GET | admin/reports/leads | The leads report. |
GET | admin/reports/delivery | The delivery report. |
GET | admin/reports/support | The support report. |
GET | admin/reports/statement/{customer} | A customer's statement. |
GET | admin/reports/export/{report} | Downloads one table as format=csv (the default) or xlsx; used by the CSV and Excel buttons. |